Understanding how your systems perform is no longer optional; it’s essential. Telemetry data has become the backbone of modern system monitoring, providing real-time insights that help organizations maintain optimal performance and prevent costly downtime. Whether you’re managing a complex cloud infrastructure, monitoring application health, or tracking user interactions, this continuous stream of information gives you the visibility needed to make informed decisions quickly.
Effective Employee Goal Setting For Lasting Success, much like monitoring system performance, relies on continuous, real-time data. Just as telemetry allows businesses to monitor system health and make adjustments, organizations can also track progress on employee goals and performance to ensure long-term success.
The telemetry data meaning refers to the automated process of collecting measurements and statistics from remote or inaccessible systems and transmitting them to monitoring equipment for analysis. Think of it as your system’s vital signs, constantly streaming information about health, performance, and behavior.
As systems become increasingly complex and distributed, organizations that leverage telemetry data effectively can reduce downtime by up to 80%, improve response times significantly, and gain a competitive edge through data-driven optimization.
In A Hurry Podcast Now!
1. Real-Time Performance Monitoring and Bottleneck Identification:
One of the most significant advantages of telemetry data is its ability to provide real-time visibility into system performance. Instead of waiting for users to report problems or discovering issues during post-mortem analysis, you can monitor your systems continuously and catch problems as they emerge.
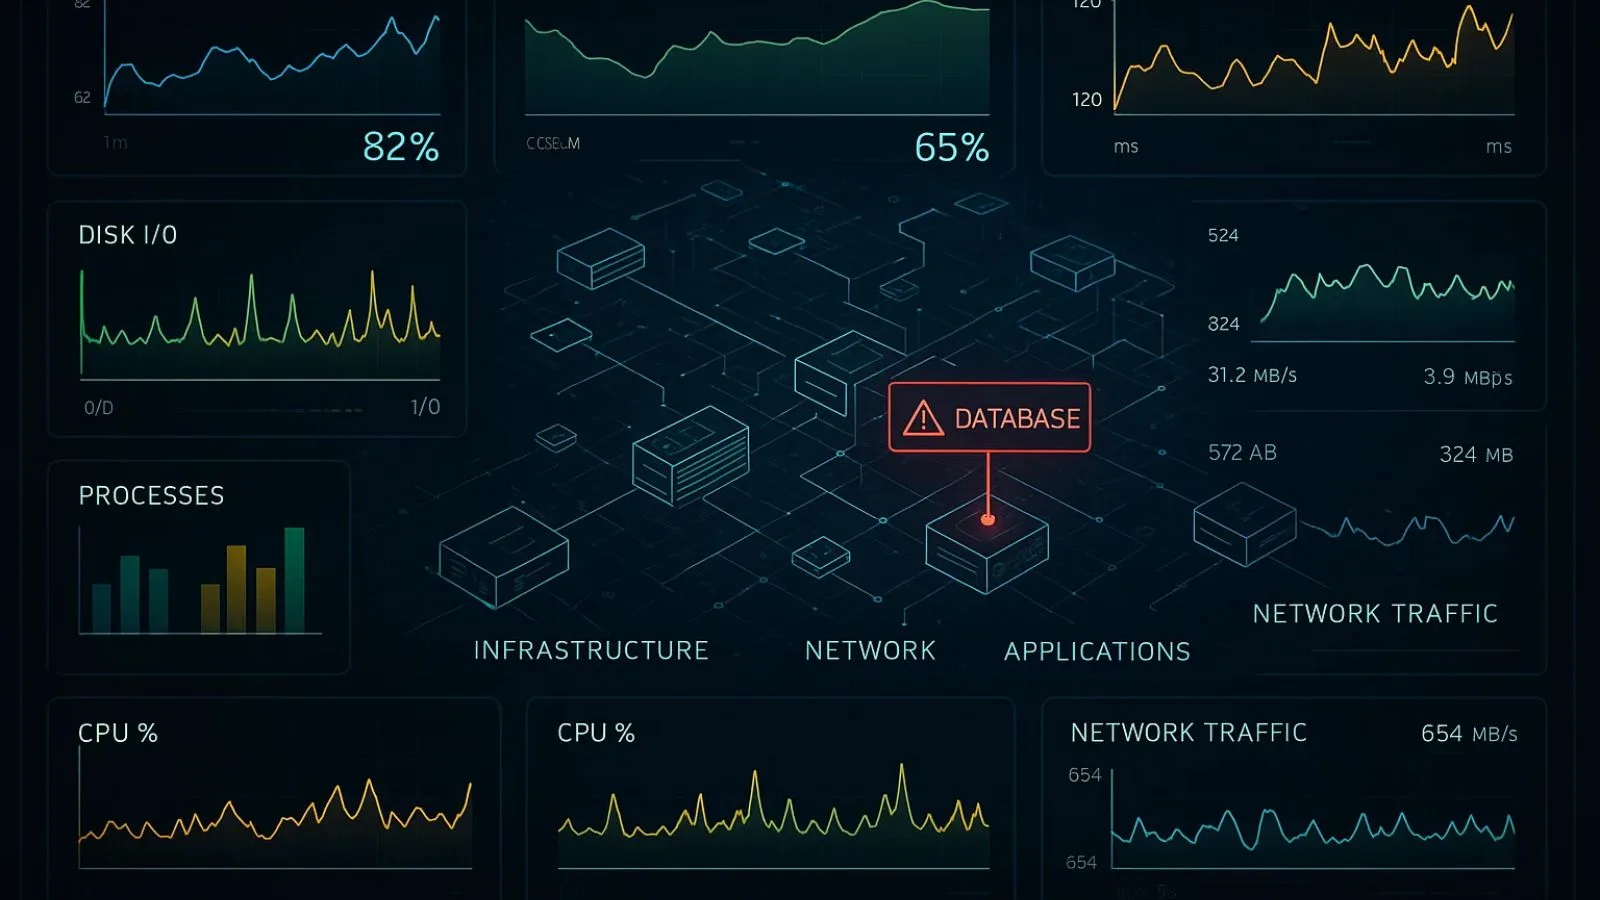
When you implement comprehensive telemetry data collection, you capture critical metrics such as CPU usage, memory consumption, disk I/O operations, network latency, and application response times.
These metrics, when analyzed in real-time, quickly reveal performance bottlenecks that might be slowing down your systems. For instance, if your application suddenly shows increased response times, the data helps you pinpoint whether the issue stems from database queries, API calls, or resource constraints.
Modern monitoring solutions collect telemetry data from every layer of your technology stack, from infrastructure and networks to applications and user interfaces. This comprehensive view allows you to trace performance issues across distributed systems and understand root causes rather than just treating symptoms.
When you notice a spike in error rates or latency, you can drill down through the collected information to identify the exact component causing the problem. The key to effective real-time monitoring is setting up appropriate alerts and thresholds.
By establishing baselines from historical telemetry data, you can configure intelligent alerts that notify your team when metrics deviate from normal patterns. This proactive approach means you’re fixing issues before they impact users, rather than reacting to complaints after the fact.
2. Predictive Maintenance and Proactive Issue Resolution:
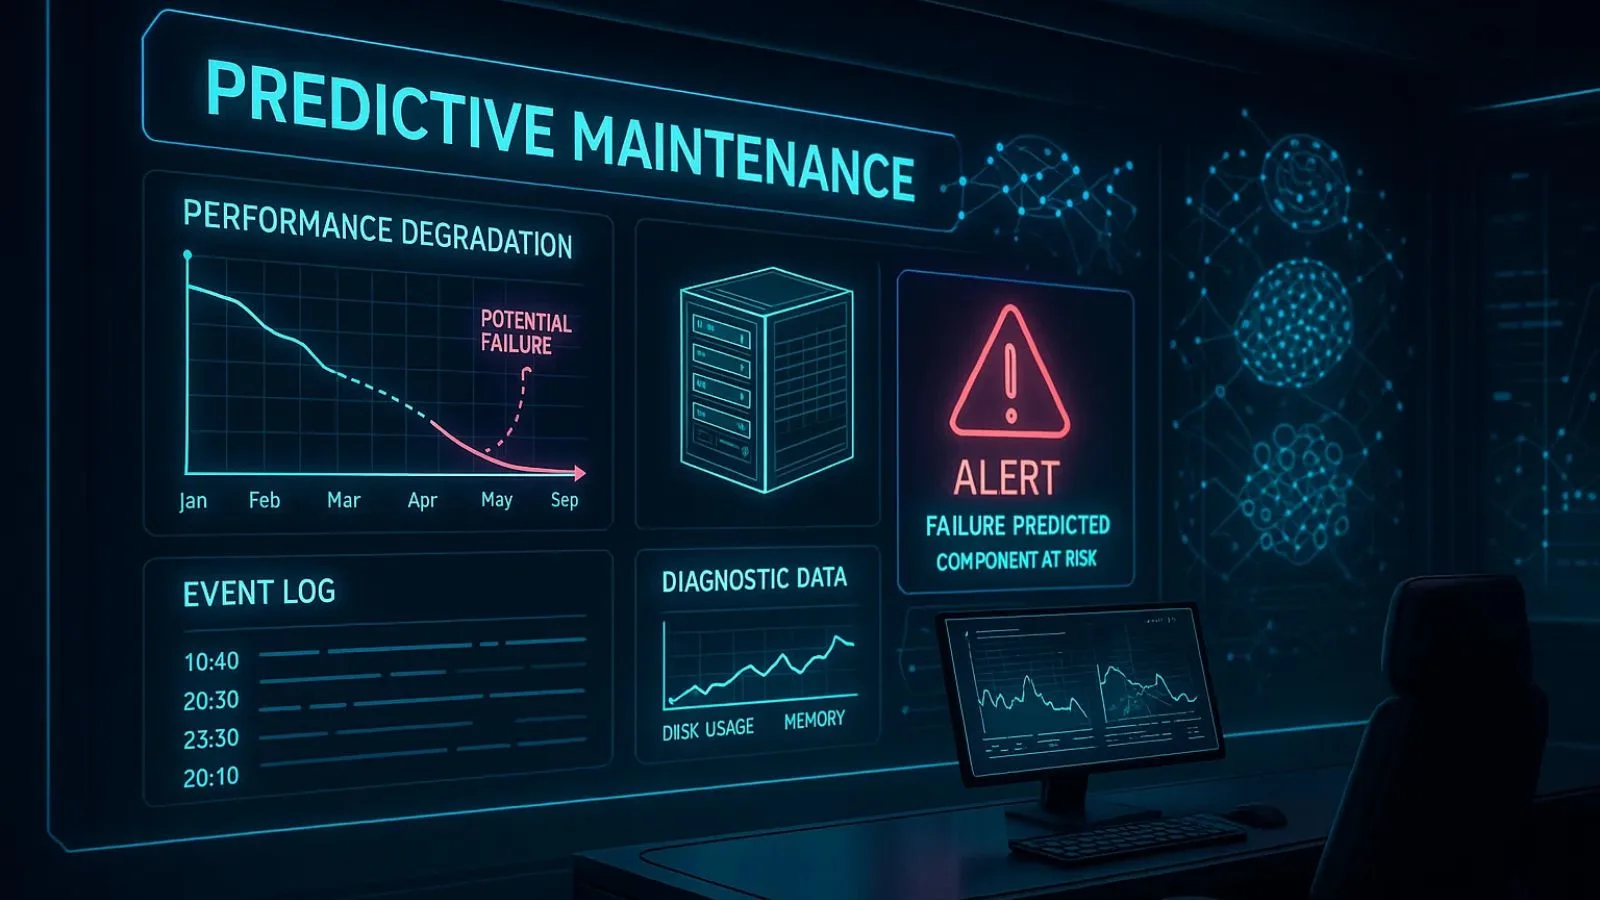
Beyond responding to current problems, telemetry data enables you to predict and prevent future issues. By analyzing patterns and trends over time, you can identify early warning signs of potential failures and take corrective action before they cause downtime.
Understanding the different telemetry types becomes crucial here. Performance telemetry tracks system metrics over time to identify degradation patterns. Event telemetry captures specific occurrences that might indicate emerging issues.
Diagnostic telemetry provides detailed information about system states that can reveal underlying problems. By combining these different approaches, you create a comprehensive predictive maintenance strategy.
Consider this scenario: your telemetry data shows that disk usage has been steadily increasing over several weeks. With this insight, you can proactively expand storage before it reaches capacity and causes system failures.
Similarly, if memory usage patterns indicate a potential memory leak, you can schedule maintenance during off-peak hours rather than dealing with an emergency outage at the worst possible time.
Machine learning algorithms can analyze vast amounts of telemetry data to identify patterns that human analysts might miss.
These algorithms predict when specific components are likely to fail based on historical data, allowing you to schedule replacements during planned maintenance windows. This approach transforms your IT operations from reactive firefighting to proactive system optimization.
The cost savings from predictive maintenance are substantial. Unplanned downtime can cost large enterprises thousands of dollars per minute. By using telemetry data to prevent these incidents, organizations dramatically reduce operational costs while improving system reliability and user satisfaction.
3. Resource Optimization and Capacity Planning:
Effective resource management is crucial for both performance and cost efficiency, and telemetry data provides the insights needed to optimize resource allocation across your infrastructure.
Without accurate data, organizations often over-provision resources to avoid performance issues, leading to wasted spending, or under-provision resources, resulting in poor performance.
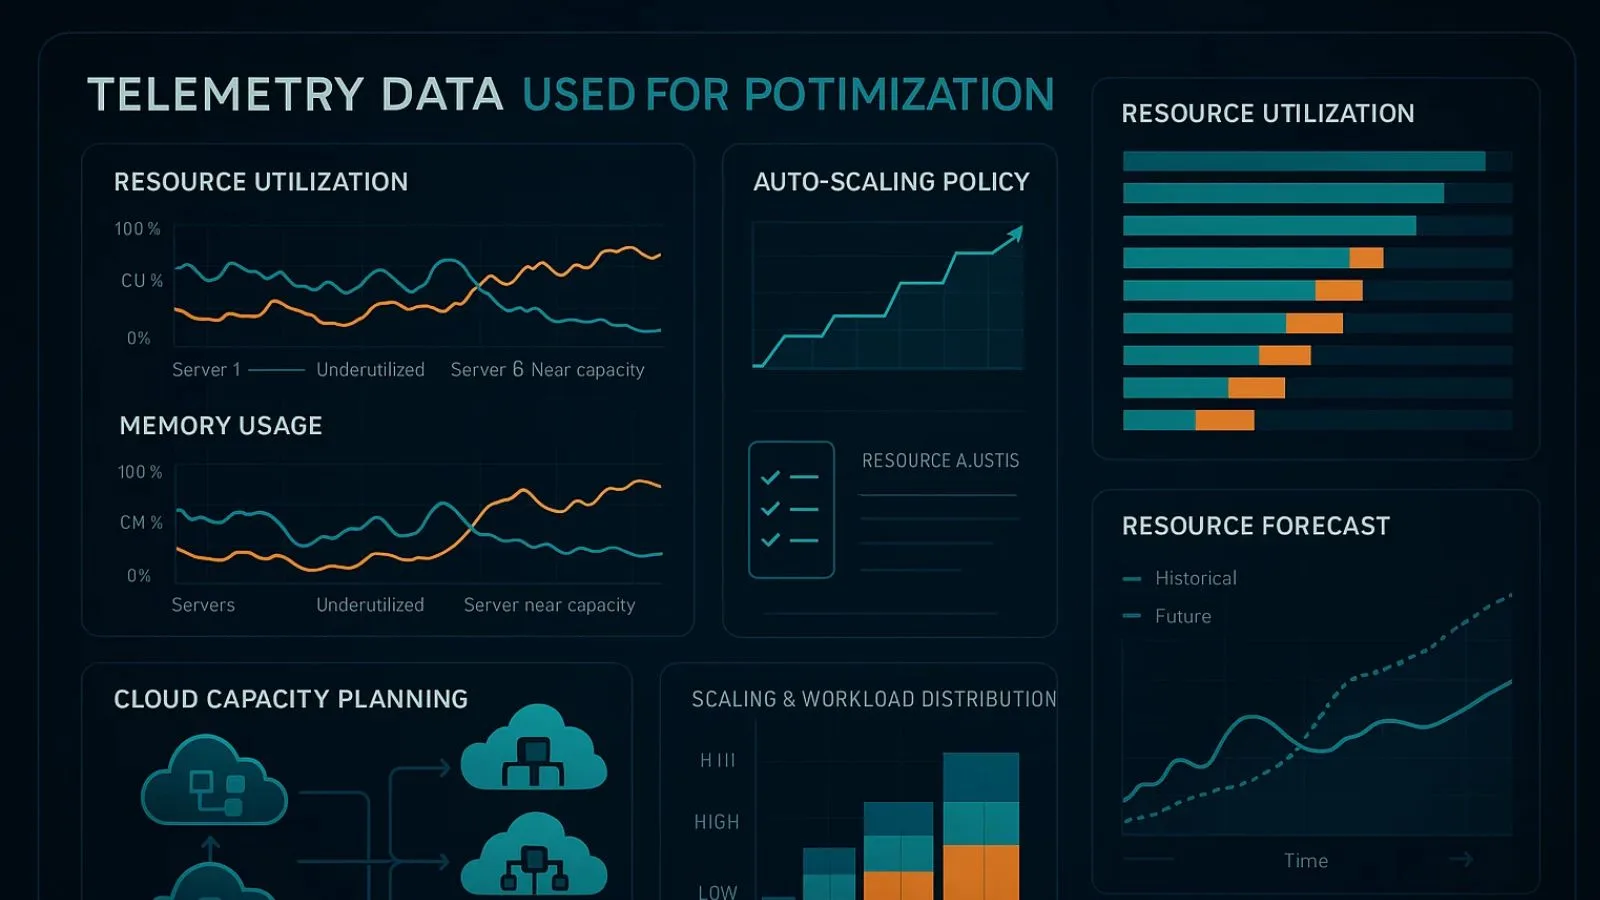
Real-world telemetry data examples demonstrate this perfectly. You might discover through collected metrics that certain servers consistently operate at only 20% capacity while others are regularly maxed out.
This information allows you to redistribute workloads more effectively, ensuring better performance without purchasing additional hardware. Another common example involves tracking API call volumes to determine optimal server counts, or monitoring database query performance to identify indexing opportunities.
Cloud environments particularly benefit from telemetry-driven resource optimization. Since cloud resources are billed based on usage, the collected metrics help you right-size your instances, identify idle resources, and implement auto-scaling policies that adjust capacity based on actual demand. This can lead to significant cost reductions, sometimes 30-40% or more, while maintaining or improving performance levels.
Capacity planning becomes much more accurate when based on real telemetry data rather than estimates or assumptions. By analyzing historical patterns, you can predict future resource needs with greater confidence.
If your monitoring shows consistent growth in database transactions, you can plan infrastructure expansions before performance degrades. This data-driven approach ensures you invest in capacity at the right time, avoiding both premature spending and emergency upgrades.
4. Enhanced Security and Anomaly Detection:
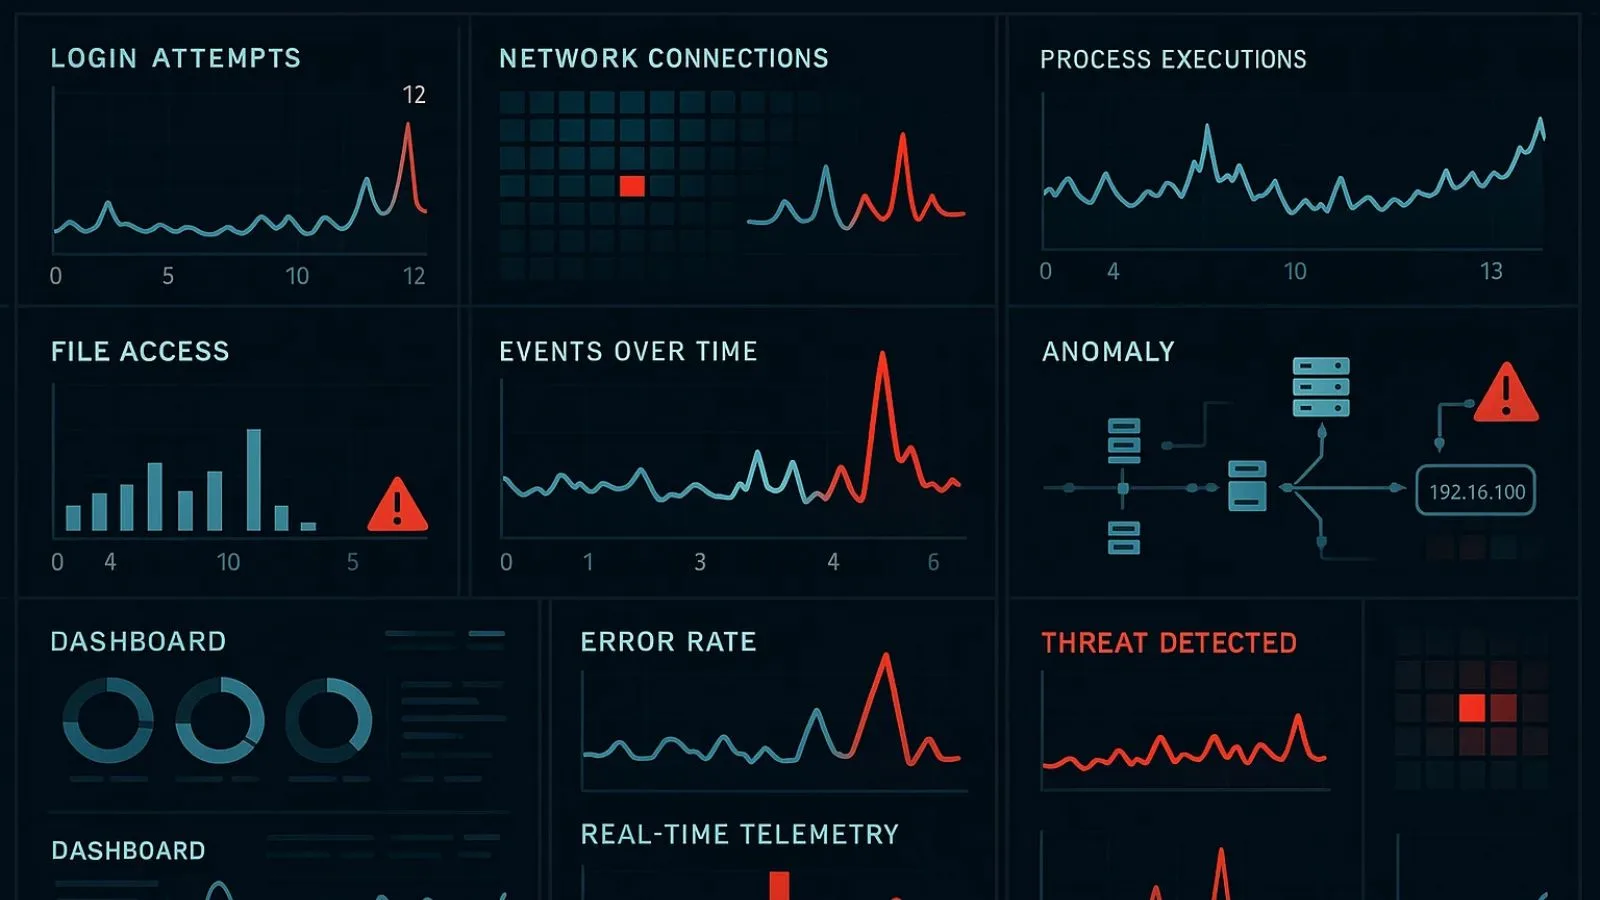
Security threats and system anomalies often manifest as unusual patterns in system behavior, making telemetry data an invaluable tool for detecting and responding to security incidents. By continuously monitoring system activities and establishing baselines for normal behavior, you can quickly identify deviations that might indicate security breaches, malware infections, or system compromises.
The information captured includes login attempts, file access patterns, network connections, process executions, and system configuration changes. When analyzed collectively, this data can reveal sophisticated attacks that might go unnoticed if you’re only looking at individual events. For instance, a gradual increase in data transfers to an external IP address, visible in your monitoring dashboard, could indicate data exfiltration by an attacker.
Modern security information and event management (SIEM) systems rely heavily on telemetry data to correlate events across multiple systems and identify potential threats. By aggregating information from servers, applications, network devices, and security tools, these systems can detect complex attack patterns and alert security teams to investigate suspicious activities before significant damage occurs.
Beyond external threats, telemetry data helps identify internal system anomalies that affect performance. Unusual spikes in error rates, unexpected service dependencies, or irregular resource consumption patterns can all indicate problems that need investigation. Sometimes these anomalies point to bugs in code deployments, misconfigurations, or hardware failures rather than security issues, but detecting them quickly is crucial regardless of the cause.
Organizations using employee monitoring software often incorporate system-level telemetry to track usage patterns and identify potentially risky behaviors while maintaining privacy. This approach focuses on system activities and resource consumption rather than invasive monitoring, helping maintain security while respecting employee autonomy.
5. Accelerated Troubleshooting and Root Cause Analysis:
When systems fail or performance degrades, every minute of downtime costs money and damages user trust.
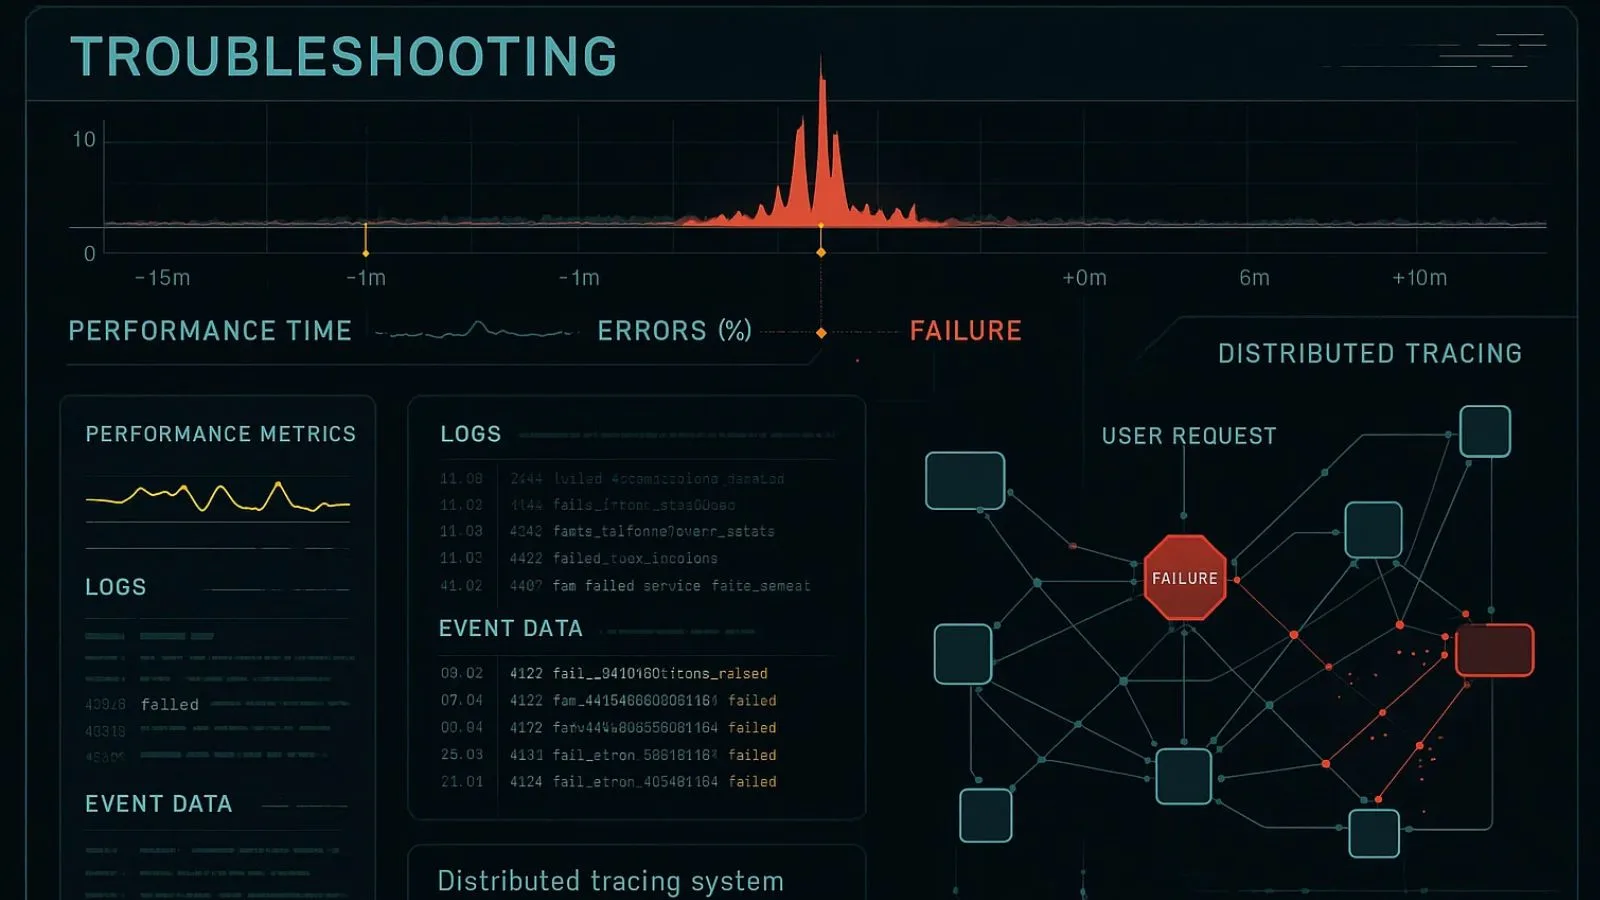
Telemetry data dramatically accelerates troubleshooting by providing detailed information about system states before, during, and after incidents. Instead of trying to reproduce problems or relying on incomplete user reports, you have comprehensive data trails that reveal exactly what happened.
Effective troubleshooting starts with proper instrumentation. By ensuring your systems generate detailed telemetry data across all critical components, you create a rich dataset that supports forensic analysis. This includes not just performance metrics but also logs, traces, and events that capture the full context of system operations.
When an incident occurs, telemetry data helps you quickly narrow the problem scope. You can identify which specific services or components were affected, determine the timeline of events, and understand the cascade of failures that may have occurred.
Distributed tracing, a specialized form of telemetry data, is particularly valuable for troubleshooting issues in microservice architectures, where a single user request might touch dozens of services.
Root cause analysis becomes significantly more effective when supported by comprehensive telemetry data. Rather than speculating about causes or making assumptions based on incomplete information, you can examine the actual data to understand what triggered the problem.
Did a configuration change correlate with the incident? Was there a sudden spike in traffic? Did a dependency failure cause cascading issues? Your collected metrics provide definitive answers.
Also Read!
How To Implement Remote Employee Monitoring Without Micromanaging
How EmpCloud Enhances Workforce Performance Through Integrated Monitoring?
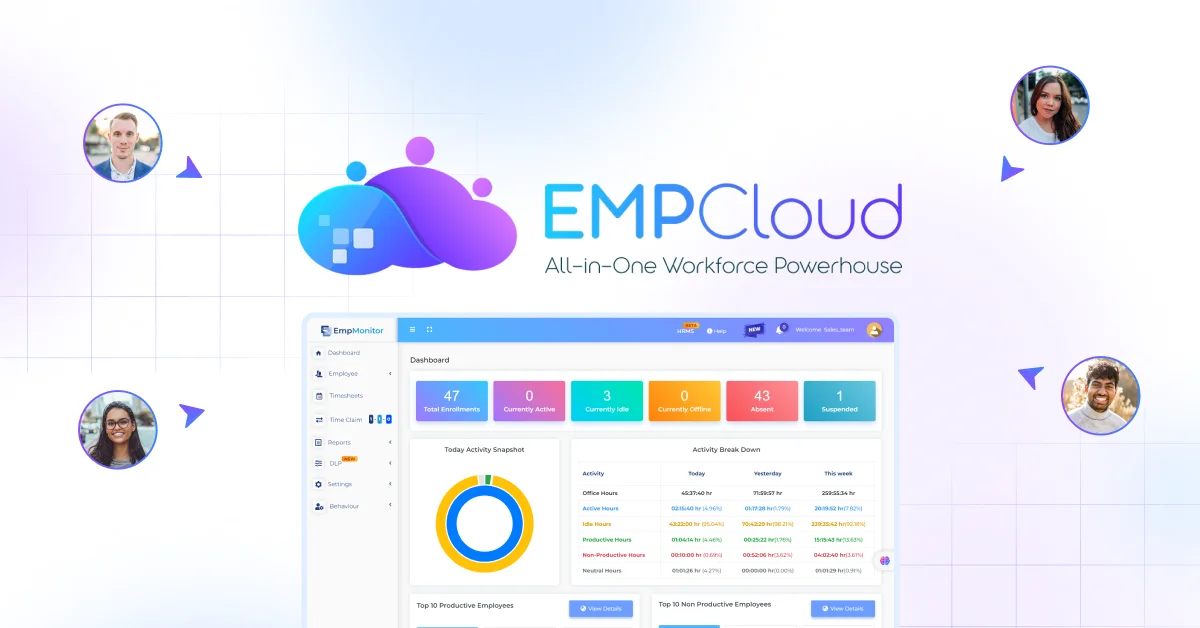
EmpCloud takes a comprehensive approach by combining system telemetry data with workforce management to deliver actionable performance insights. This unified platform helps organizations optimize both their technology infrastructure and human resources simultaneously.
EmpCloud’s integrated suite includes
1. EmpMonitor for real-time productivity tracking and internet activity monitoring, providing instant visibility into how system resources are being utilized.
Biometric attendance with facial recognition technology ensures accurate workforce accountability while generating valuable pattern data.
Field Force Management offers geo-location tracking for mobile teams, optimizing operational efficiency.
2. HRMS module streamlines attendance, leave management, and compliance documentation.
3. It provides you with a Project Management tool that supports features like Gantt charts and Kanban boards to keep track of ongoing projects and assignments.
4. Performance Management monitors employee growth by tracking their skill development and accordingly rewards them with incentives or appraisals.
5. Payroll Management automates compensation processing with accurate tax compliance.
6. Exit Management maintains comprehensive employee portfolios even during offboarding.
The platform’s ability to correlate system performance metrics with workforce productivity data enables better decision-making about infrastructure investments and resource allocation, transforming raw telemetry into strategic business outcomes.
Best Practices for Implementing Effective Telemetry Collection:
Successfully leveraging telemetry data requires thoughtful implementation and ongoing management. Start by identifying the most critical metrics for your specific systems and business objectives. While it’s tempting to collect everything, excessive data can lead to storage costs, analysis paralysis, and difficulty identifying the signal from the noise.
Standardize your collection formats and methods across systems wherever possible. Using consistent naming conventions, timestamps, and data structures makes it much easier to correlate information from different sources and build unified views of system performance. Industry standards like OpenTelemetry can help ensure your implementation is interoperable and future-proof.
Implement appropriate data retention policies that balance analytical needs with storage costs and compliance requirements.
You might keep highly detailed telemetry data for recent periods while aggregating older data to preserve long-term trends without excessive storage requirements.
Invest in proper visualization and analysis tools that help teams extract value without requiring deep technical expertise. Dashboards that present key metrics clearly, alert systems that notify the right people at the right time, and analysis tools that support investigation are all essential components of an effective strategy.
Conclusion:
Telemetry data has evolved from a monitoring tool to an essential component of modern IT operations.
By implementing real-time monitoring, predictive maintenance, resource optimization, security enhancement, and accelerated troubleshooting, you can dramatically improve system performance while reducing costs and downtime.
The key lies in transforming collected information into actionable insights that drive continuous improvement. Start with clear objectives, implement appropriate tools, and foster a data-driven culture.
As your monitoring capabilities mature, system performance issues become easier to predict, prevent, and resolve, ultimately delivering better experiences and stronger business outcomes.
FAQ’s:
Q1: What is the difference between telemetry data and regular logs?
Ans: Telemetry data typically refers to structured metrics collected at regular intervals, such as CPU usage or response times. Logs are event-based records capturing specific occurrences. Modern observability combines both for comprehensive system understanding.
Q2: How much telemetry data should organizations collect?
Ans: Focus on information that supports specific business objectives and operational needs. Start with key performance indicators and expand based on actual requirements rather than collecting everything possible.
Q3: Can excessive collection impact system performance?
Ans: Yes, poorly implemented collection can affect performance. Use sampling techniques for high-volume metrics and implement efficient collection agents to minimize impact.
Q4: How long should telemetry data be retained?
Ans: Retention periods vary based on regulatory requirements and analysis needs. Common approaches include detailed recent data (days to weeks), aggregated medium-term data (months), and summarized long-term trends (years).

